Nano Banana Tutorial: Product Photos, UGC, and Ads

Top Insights
Nano Banana Pro Tutorial: Product Photos, UGC, and Ads
Product photos used to require studios, models, and budgets. Google's Nano Banana Pro changes that math entirely. In a new tutorial, marketer Jonathan Bach shows how the image model generates photorealistic content from a single reference shot. The results are genuinely hard to spot as AI. Upload one product image and get fifty variations with different angles, lighting, and environments.

Want to test a sneaker in a luxury spa setting? Done in seconds. The model handles virtual try-ons, UGC-style selfies, and even recreates competitor ad concepts with your own products swapped in. The original Nano Banana produced unusable output. This one looks like it straight came from a real camera.
Developer Builds Full Blog in Hours Using Gemini 3
A few hours of prompting replaced weeks of web development. Fofr, a developer who experiments with AI, used Google's Gemini 3 Pro to build a complete blog from scratch. He started in AI Studio and moved to Cursor. The first working version with routing and markdown parsing took just 30 minutes.
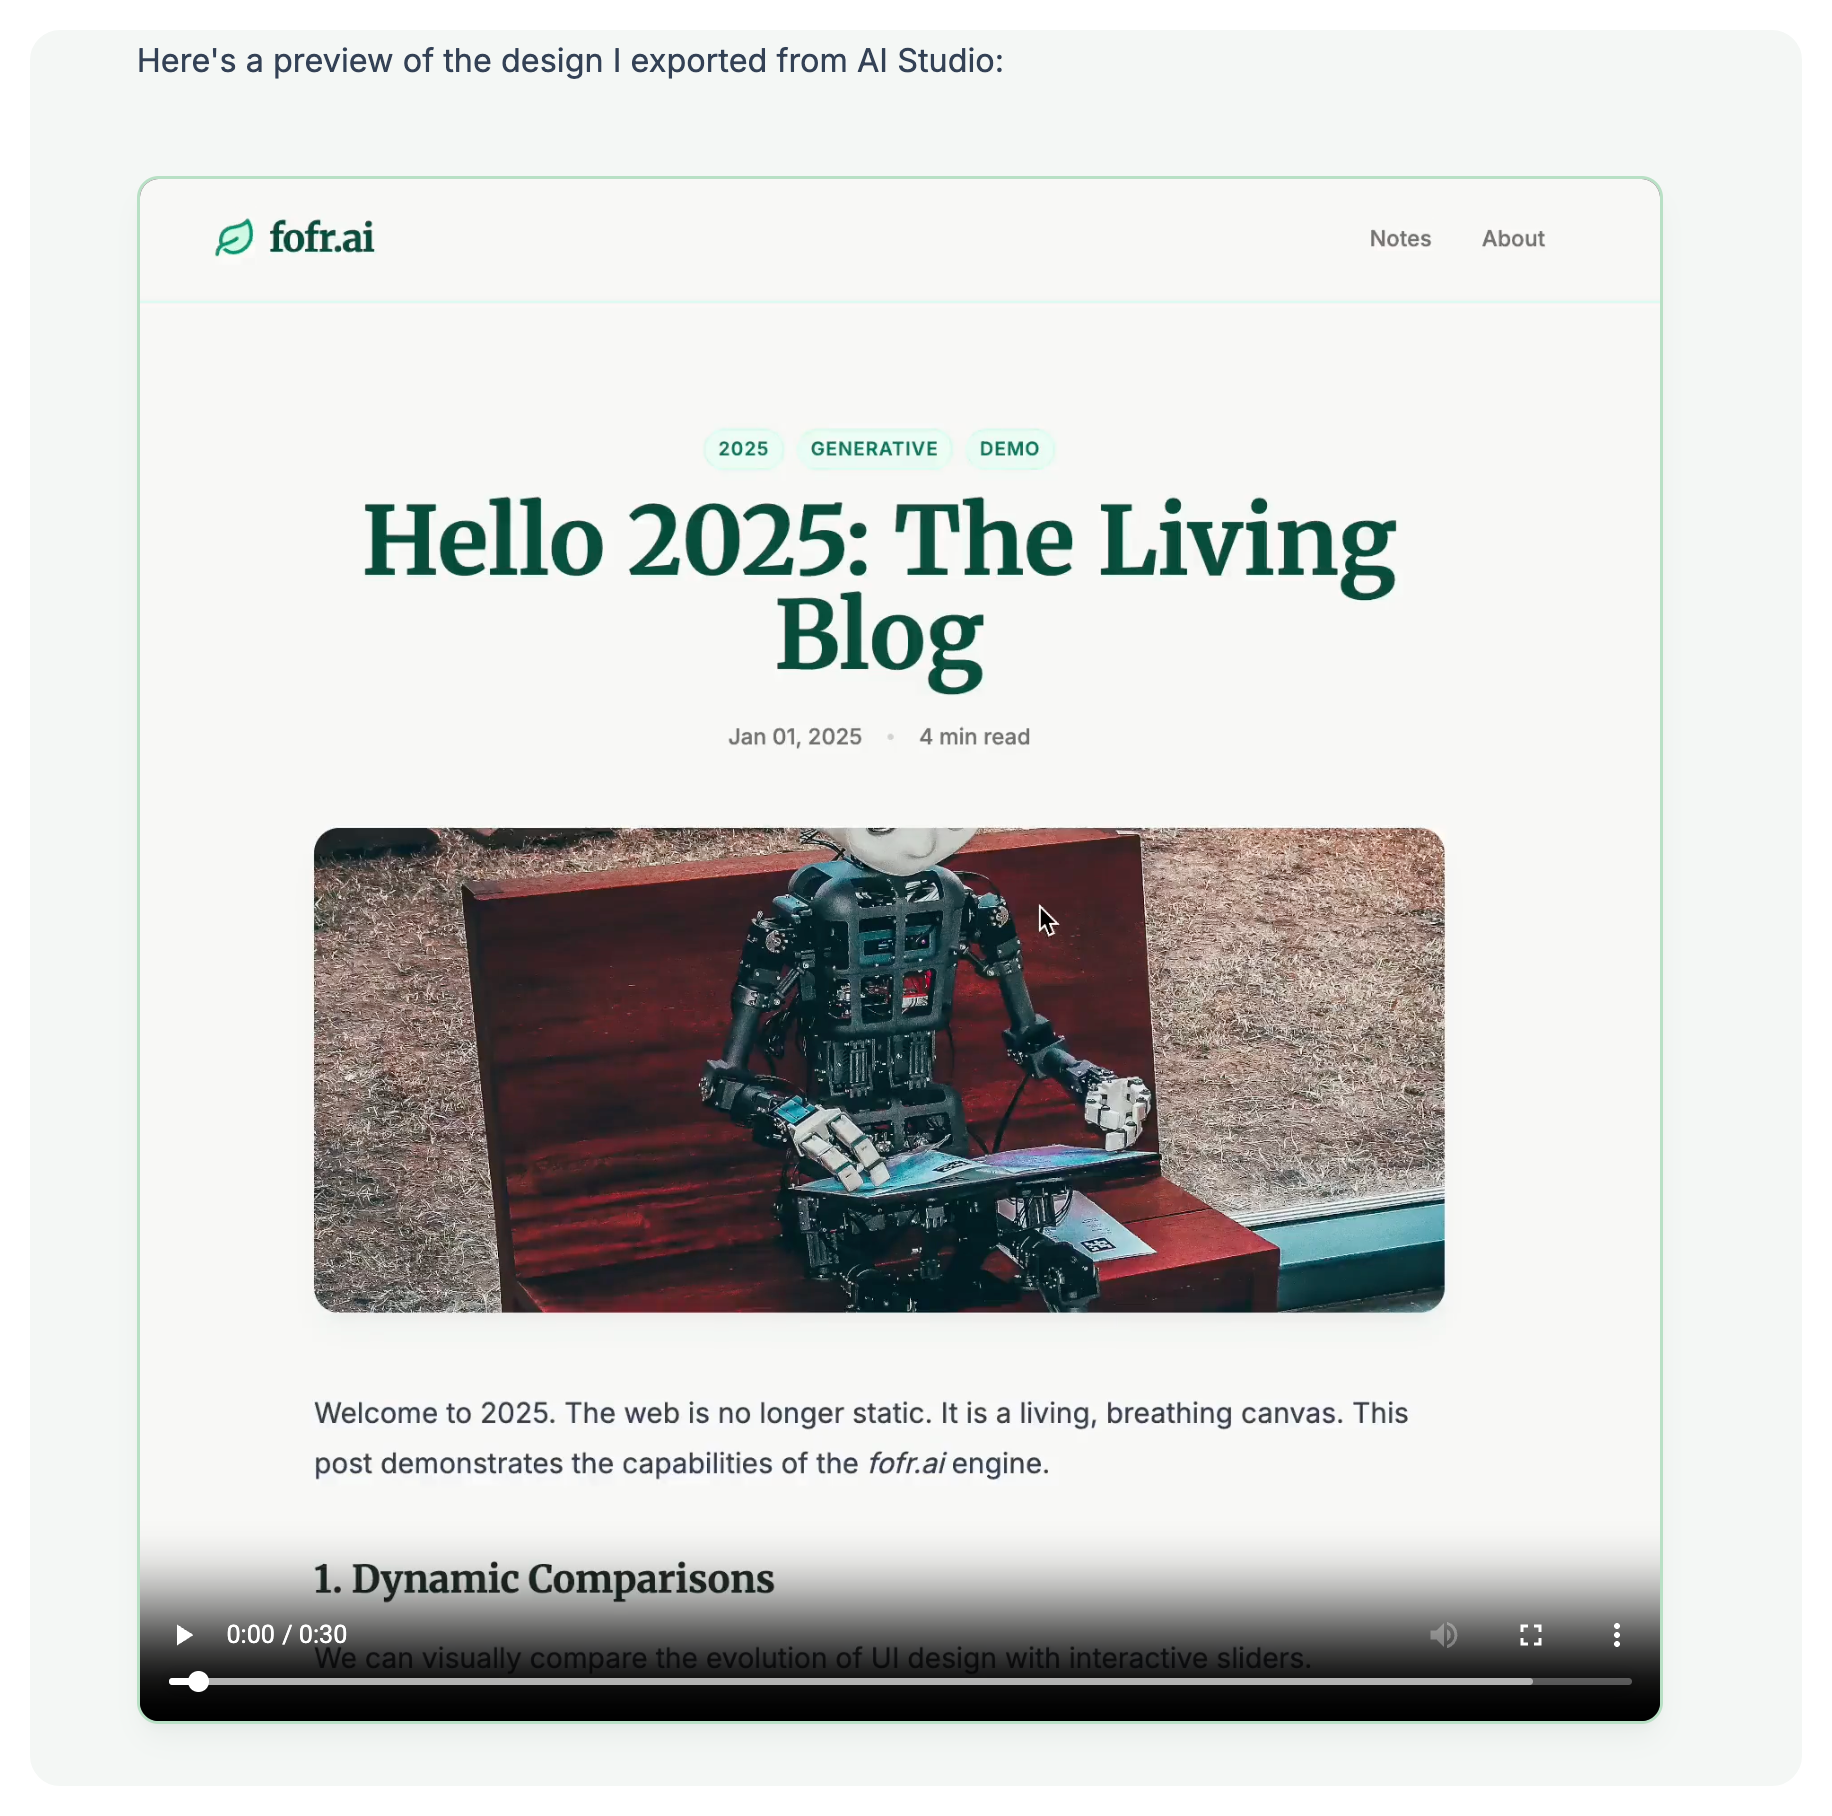
From there, he kept adding features through conversation: image lightboxes, video components, prompt displays, even linting and GitHub workflows. Hosting on Vercel and Cloudflare R2 added just another half hour. Basically, writing content now takes longer than building the platform to host it.
See the Full Step-By-Step Walkthrough
🚀 Two $100+ million copywriters discovered what REALLY drives conversions - 5 simple building blocks arranged in a specific order. This framework is so powerful that beginners are generating 5-figure profits with it. And you can learn the full system in just 33 minutes.
Discover All 5 'Copy Blocks' Now
Prompt of the Week

This Week's Feature: Business X-Ray
You can read a company's press releases. Scroll their website. Watch their CEO on CNBC talking about "unprecedented growth opportunities."
Or you could actually understand how they make money.
Business X-Ray breaks down any public company through 13 analytical layers: revenue quality, unit economics, competitive moats, capital allocation, failure modes. Feed it a ticker symbol and see exactly how the machine works, where profit actually comes from, and what could break it.
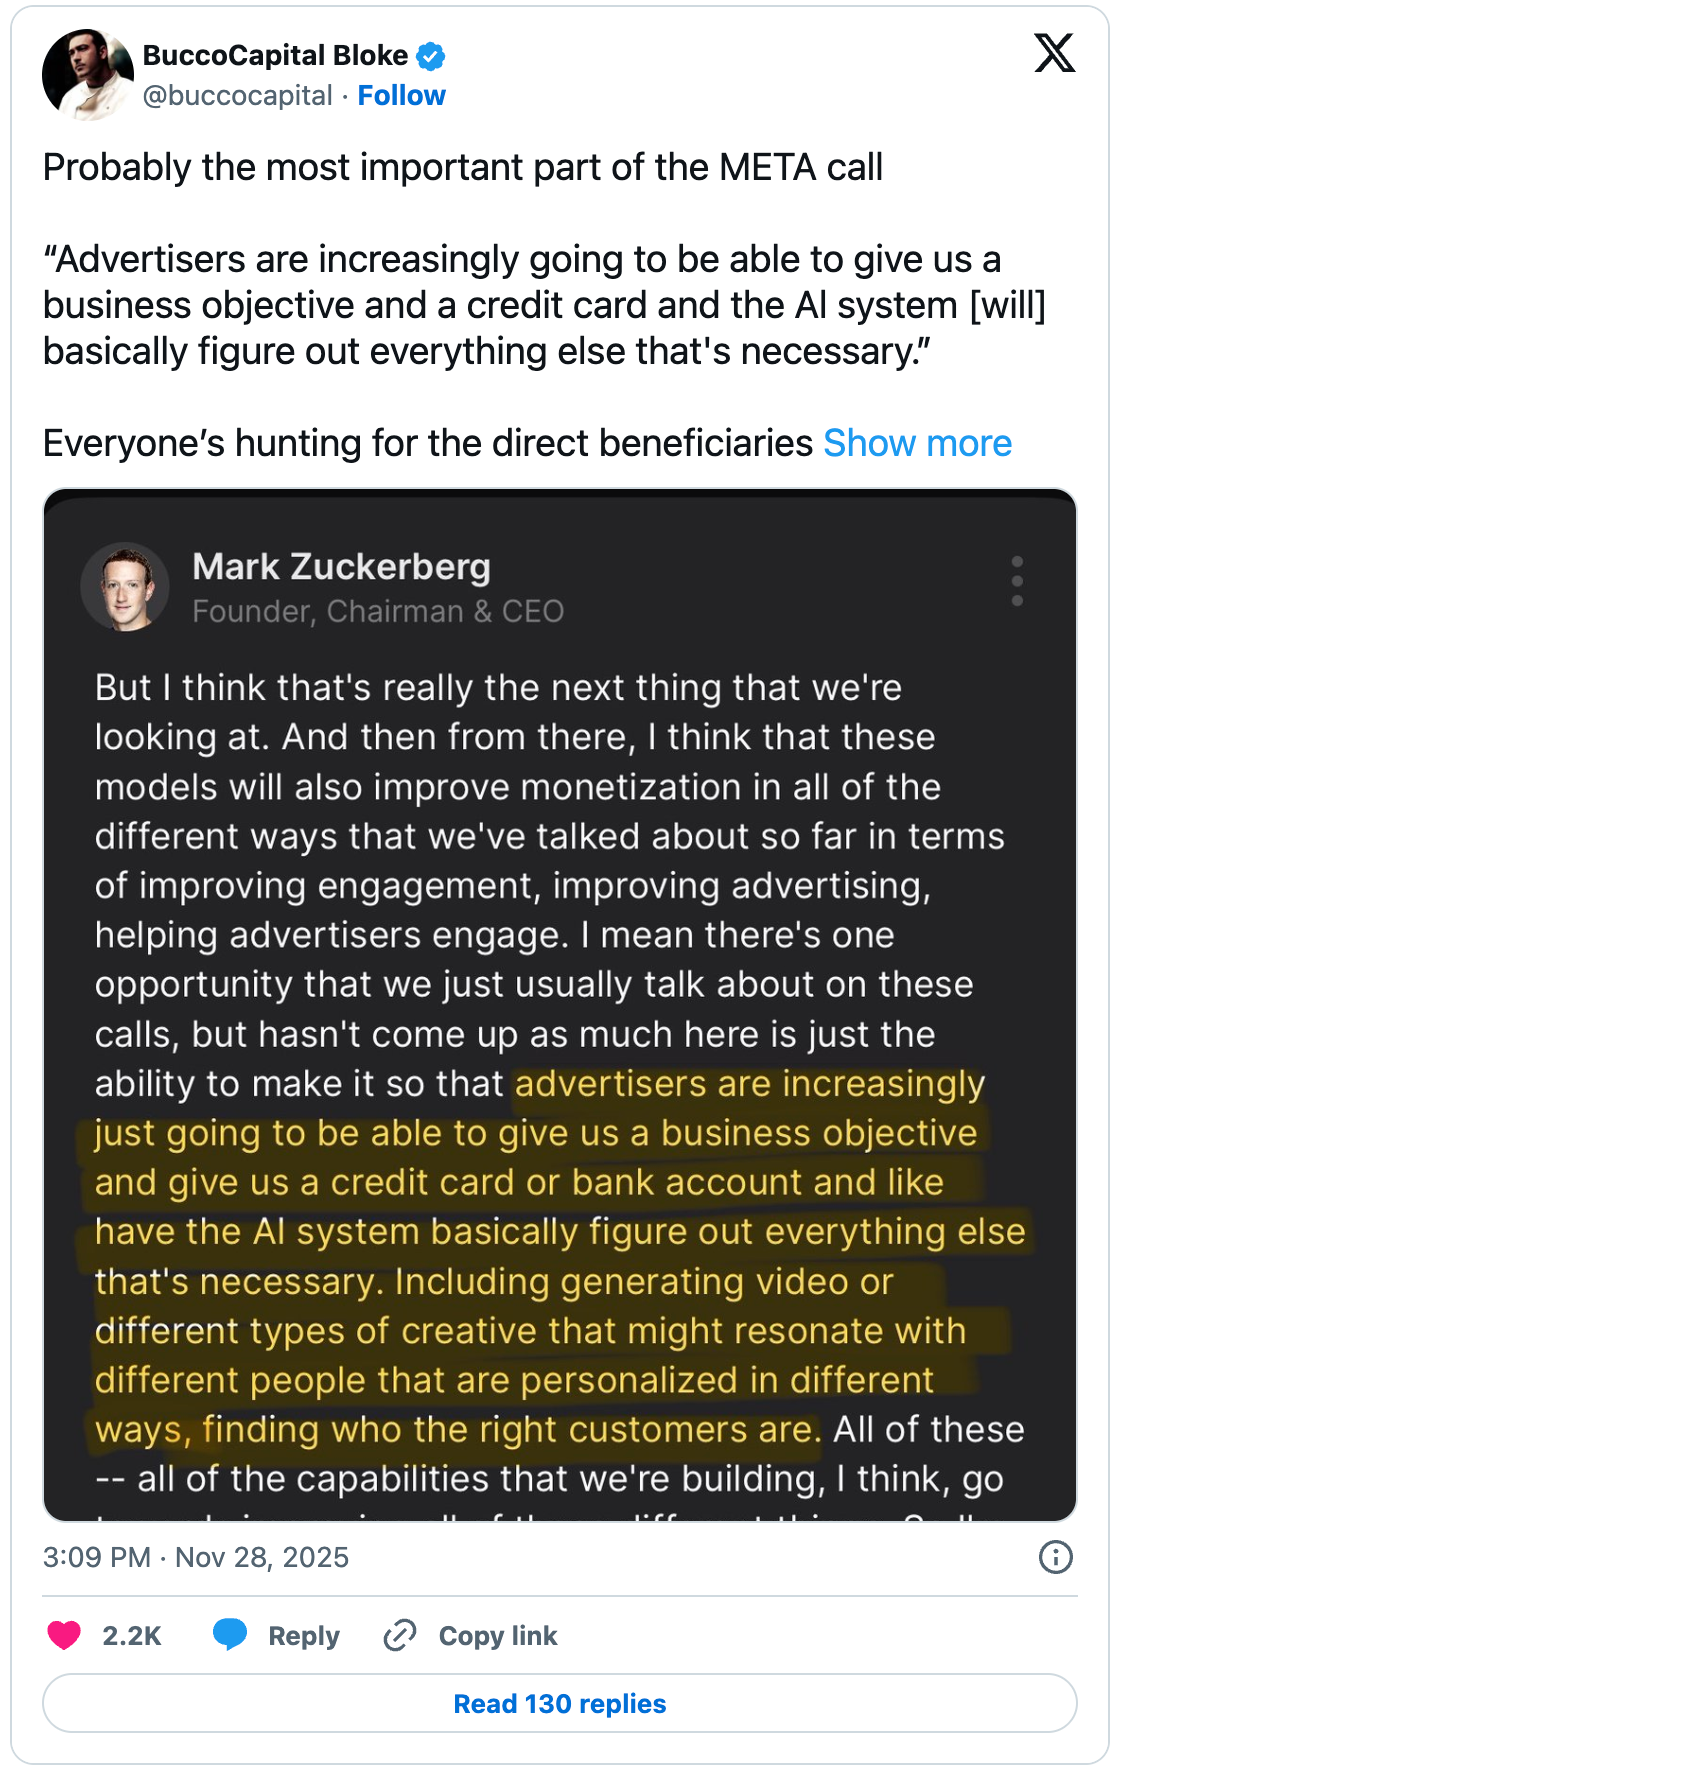
Credit to BuccoCapital on X for the prompt.
- Use only verifiable, factual information (annual reports, investor presentations, filings, earnings transcripts, and reputable financial sources).
- Be concise, analytical, and concrete, with no filler or marketing language.
Output format (exact structure required):
Executive Summary (about 150–200 words)
Summarize in plain English how this company makes money, its economic quality, and where its edge and risks lie.
End with one sentence that describes the business to an investor in one line.
1. What They Sell and Who Buys
* Describe the main products or services.
* Define target customers by type, segment, and geography, and why they buy, including the main pain point or motivation.
2. How They Make Money
* Explain the revenue model and pricing logic.
* Clarify whether revenues are one-time, recurring, transaction-based, or hybrid.
* Include key revenue segments and their share if available.
3. Revenue Quality
* Assess how predictable and diversified revenues are.
* Break down recurring versus one-off components, customer or segment concentration, and exposure to economic cycles.
4. Cost Structure
* Outline major cost drivers, such as COGS, labor, logistics, marketing.
* Include gross and operating margins where possible.
* Comment on scalability, fixed versus variable costs, and how margins move with growth.
5. Capital Intensity
* Describe the assets needed to run and grow operations.
* Include capital expenditure levels, working capital needs, and cash conversion efficiency.
6. Growth Drivers
* Identify the main levers for revenue growth, such as volume, pricing, product mix, geographic expansion, or acquisitions.
* Clarify whether each driver is structural and long term or cyclical and short term.
7. Competitive Edge
* Explain what protects the company’s economics from competition, such as brand, cost advantage, switching costs, regulation, network effects, data, or intellectual property.
* Discuss how durable and testable this moat appears, using financial evidence such as margins, ROIC, or customer retention.
8. Industry Structure and Position
* Describe the industry value chain and where profit pools sit.
* Explain market structure, for example fragmented or consolidated, presence of pricing power, and key regulatory factors.
* Place the company within this context, including market share, relative scale, and whether it acts as a price setter, a price taker, a niche specialist, or a platform.
9. Unit Economics and Key KPIs
* Present unit economics at the relevant level, such as per customer, store, device, transaction, or cohort.
* Include metrics such as CAC, LTV, churn or retention, ARPU, utilization, occupancy, and payback periods where applicable.
* Comment on whether these unit economics and KPIs are improving, stable, or weakening over time.
10. Capital Allocation and Balance Sheet
* Summarize historical capital allocation across organic investment, acquisitions, buybacks, dividends, and debt reduction.
* Describe balance sheet strength, including leverage, debt maturity profile, liquidity, and any major off balance sheet obligations.
* Assess whether capital allocation has likely created or destroyed value.
11. Risks and Failure Modes
* Identify key risks, such as competitive, technological, regulatory, macroeconomic, customer concentration, or currency exposure.
* Describe in simple terms how the equity story could fail, and what would need to happen for this to occur.
* Highlight areas where uncertainty is especially high or information is limited.
12. Valuation and Expected Return Profile
* Compare current valuation with the company’s own history and with peers, using the metrics that best fit this business, such as P/E, EV/EBIT, EV/Sales, FCF yield.
* Provide a simple scenario framework with bear, base, and bull cases, including rough assumptions and implied upside or downside.
* State explicitly what must be true for the current price to be attractive, fair, or expensive.
13. Catalysts and Time Horizon
* List near and medium term catalysts, such as product launches, margin inflection, regulatory events, refinancing, or index changes.
* Note any slow building catalysts, such as mix shift or operating leverage that accumulates over time.
* Explain the expected time horizon for the thesis to play out and how the market is likely to recognize the value if the thesis is correct.
Tone: Analytical, neutral, precise.
Goal: Produce a concise yet rich narrative that lets an investor understand how this business works, how resilient and valuable its economics are, and whether the stock looks attractive at today’s price.
Tool to Try
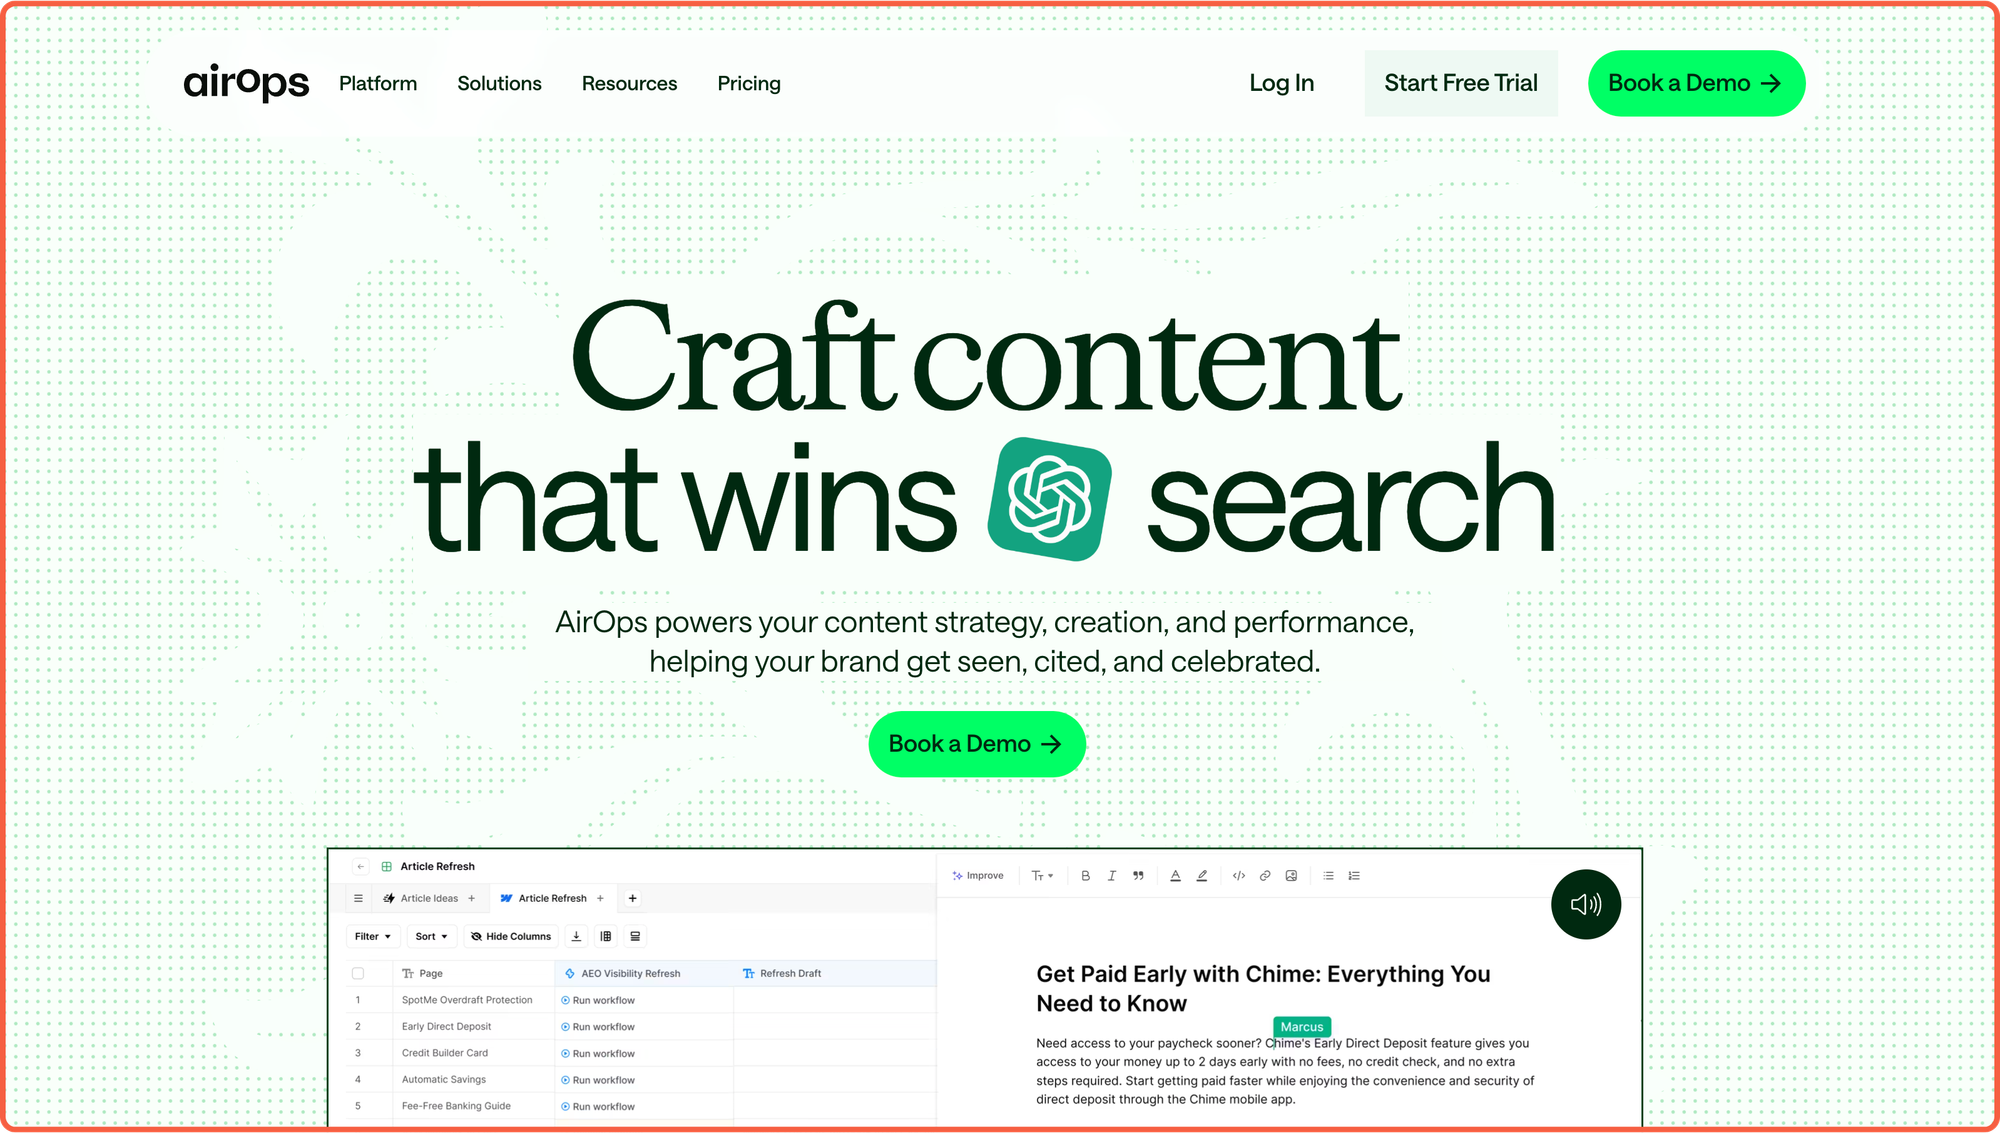
AirOps helps you win AI search by showing you exactly where your brand ranks in ChatGPT, Perplexity, and Google AI Overviews, then telling you what to do about it.
📈 Competitive Benchmarking: Compare your AI search presence against competitors and see which brands are getting cited most.
🎯 Smart Prioritization Engine: The platform analyzes thousands of opportunities and tells you which content gaps or refresh projects will actually move the needle for revenue.
⚡ Content Refresh Workflows: Identifies old content losing visibility and helps you update it fast.
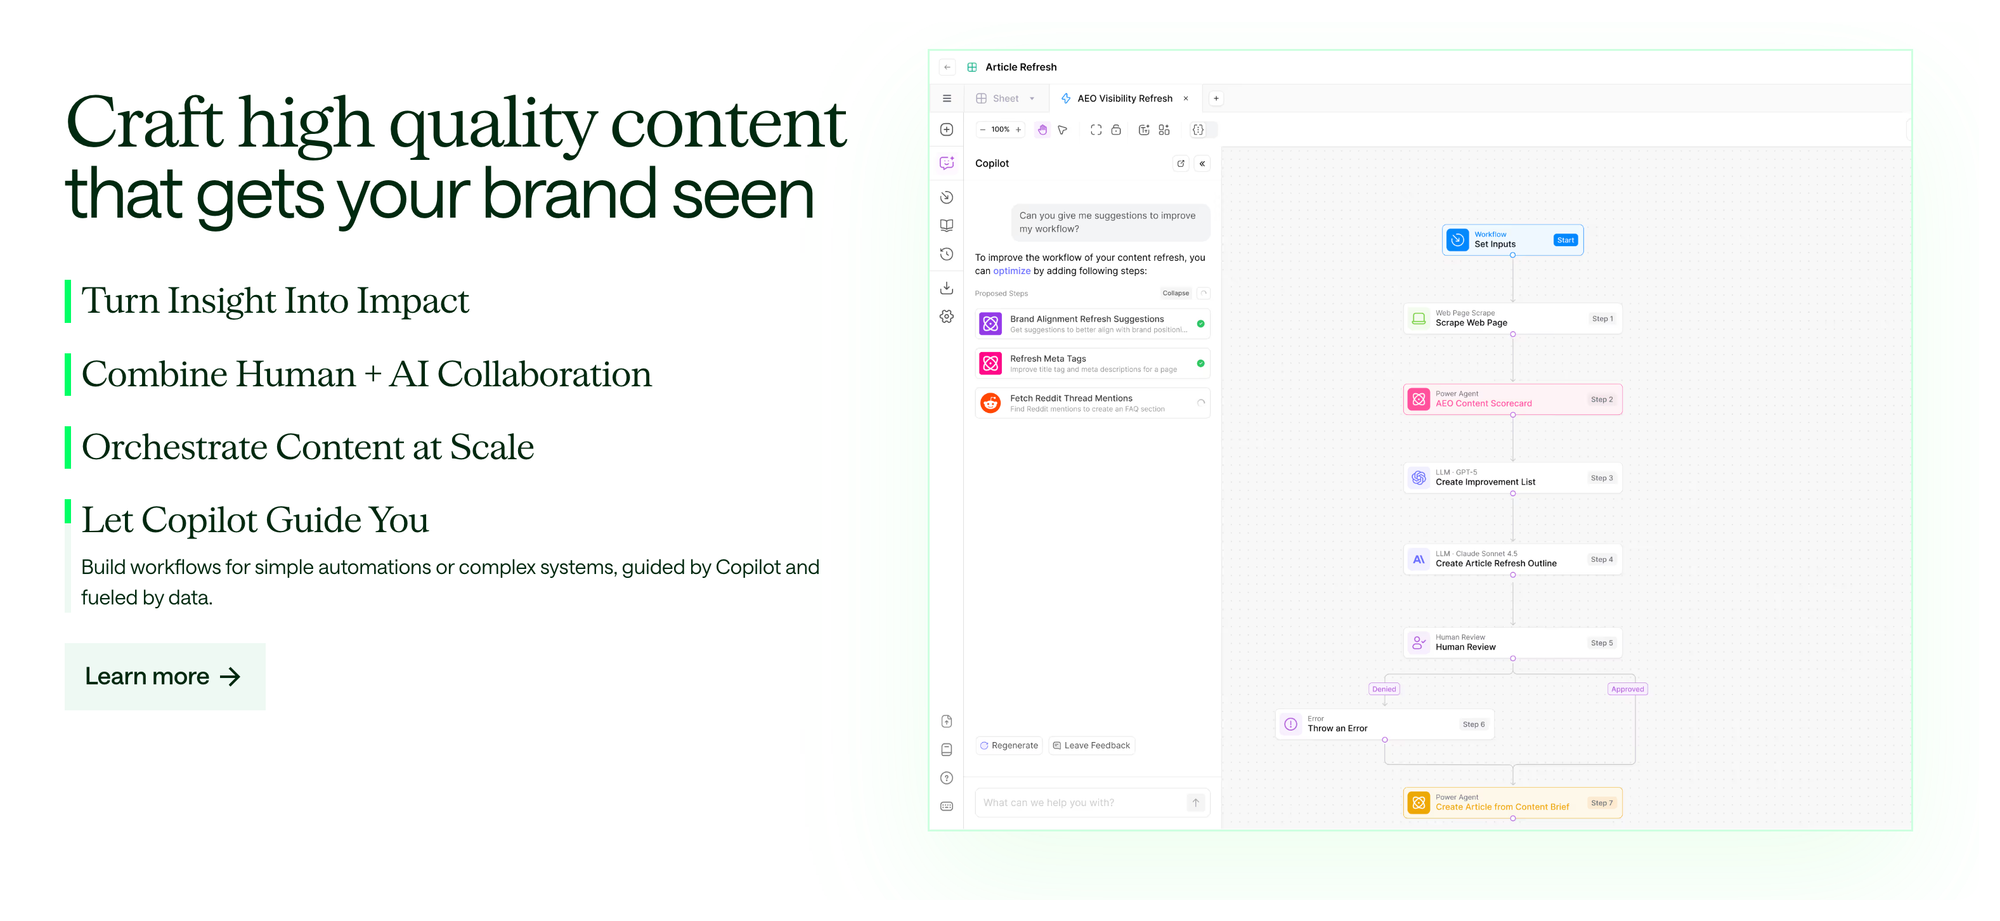
🤖 Brand-Accurate Content Creation: Builds on your knowledge base to create content that sounds like you. Not generic AI slop... actual on-brand material that ranks.
📊 Full Lifecycle Platform: Goes from competitive insights to published content in one tool. Research, planning, creation, optimization, and performance tracking all happen here.
🧠 Expert Training Included: Comes with frameworks, templates, and expert-led training to turn your content team into AI search wizards.
One More Need-to-Know News Story
Google Workspace Studio is Here: Build Custom AI Agents in Minutes
Google just launched Workspace Studio, a no-code platform for creating AI agents that automate everyday tasks across Gmail, Drive, Calendar, and Chat. Powered by Gemini 3, these agents can reason through complex workflows. Not just follow rigid rules.
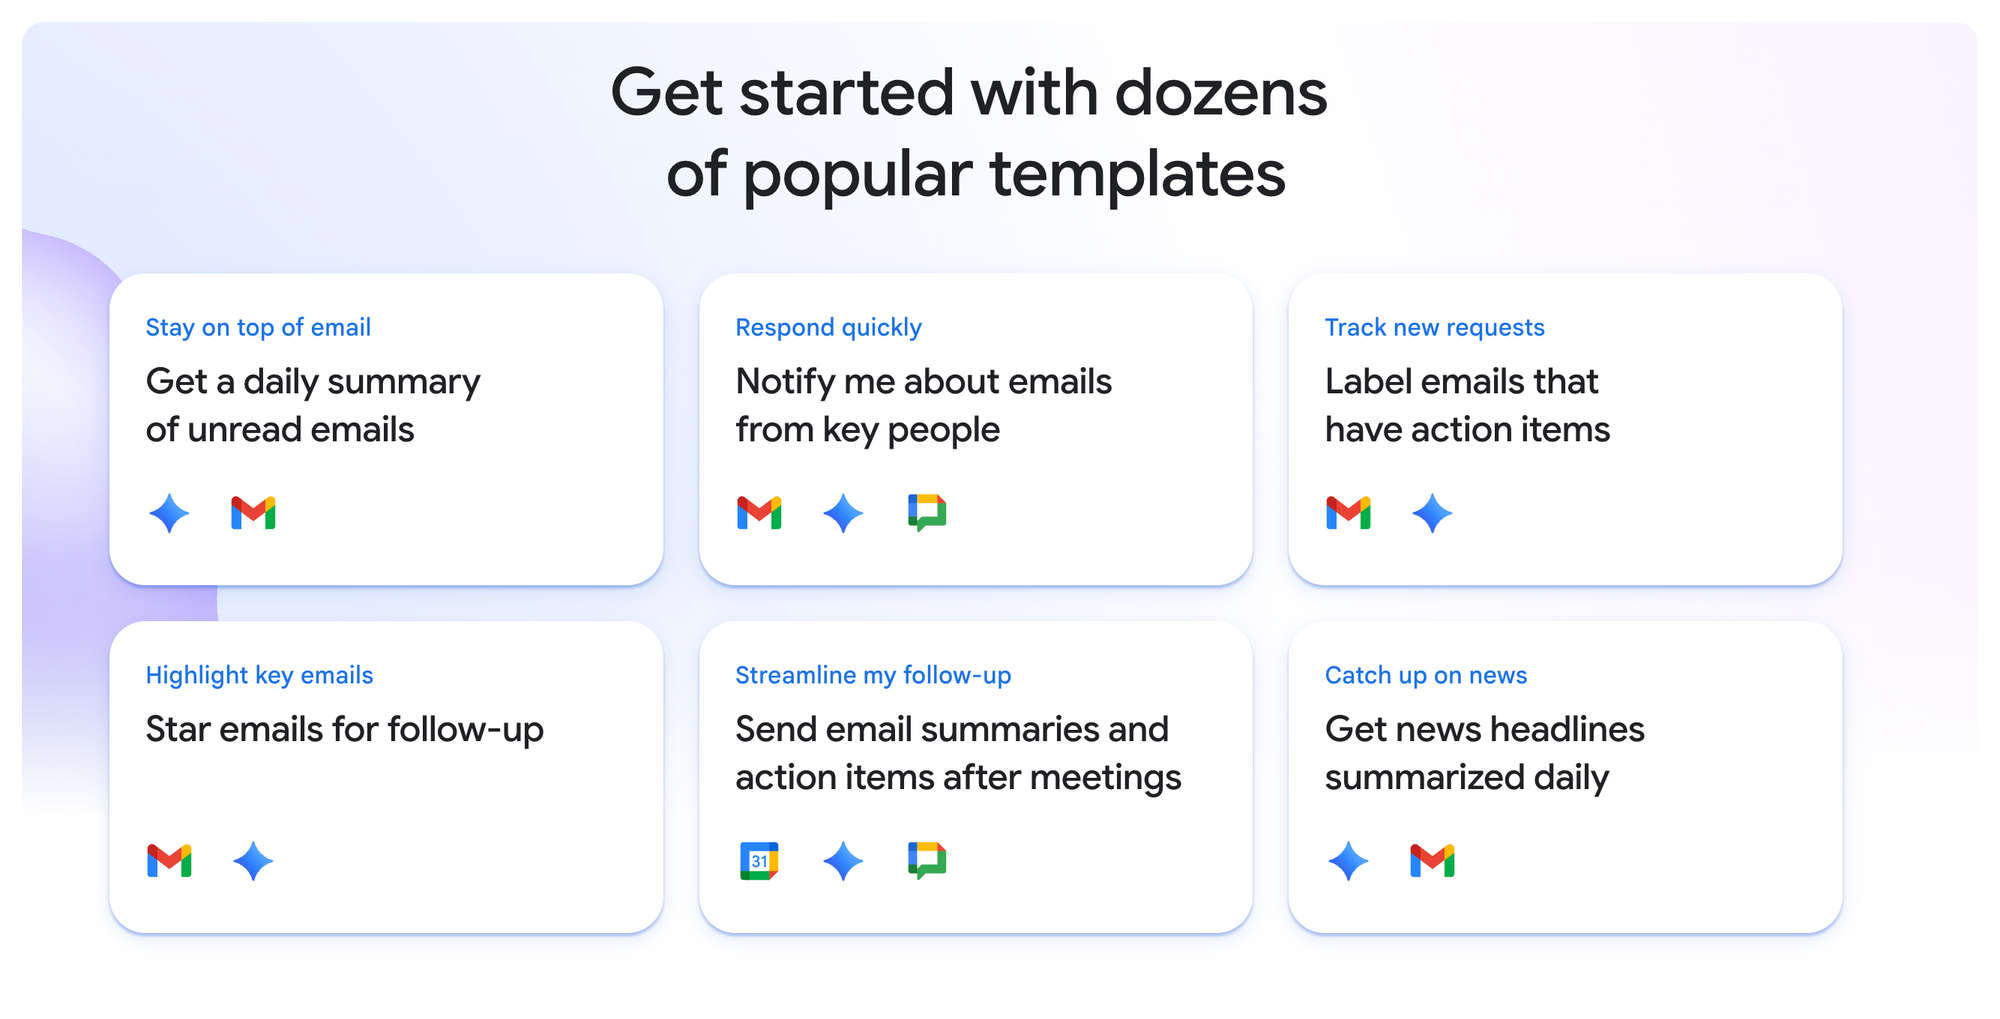
Simply describe what you want automated in plain language ("Label emails with questions and ping me in Chat") and Studio builds it. Early adopter Kärcher cut their feature-drafting time by 90% using multi-agent workflows. Pre-built integrations with Salesforce, Jira, and Asana extend automation beyond Google's ecosystem.

Mind Fodder
Thanks for reading.
Until next time!
The AI Marketers
P.S. Help shape the future of this newsletter – take a short 2-minute survey so we can deliver even better AI marketing insights, prompts, and tools.
[Take Survey Here]
